head( cars ) speed dist
1 4 2
2 4 10
3 7 4
4 7 22
5 8 16
6 9 10There are lot’s of ways to make plots in R. These include so-called “base-R” (like the plot()) and add on packages like ggplot2.
Let’s make the same plot with these two graphics systems. We can use the inbuilt cars dataset:
head( cars ) speed dist
1 4 2
2 4 10
3 7 4
4 7 22
5 8 16
6 9 10With “base R” we can simply:
plot(cars)
Now let’s try ggplot. First I need to install the package using install.packages("ggplot2").
N.B. We never run an install.packages in a code chunk otherwise we will re-install needlesely every time we render our document.
Every time we want to use an add-on package we need to load it up with a call to ‘library()’
library(ggplot2)
ggplot(cars)
Every gg plot needs at least 3 things:
ggplot(cars) +
  aes(x=speed, y=dist) +
  geom_line() +
  geom_point()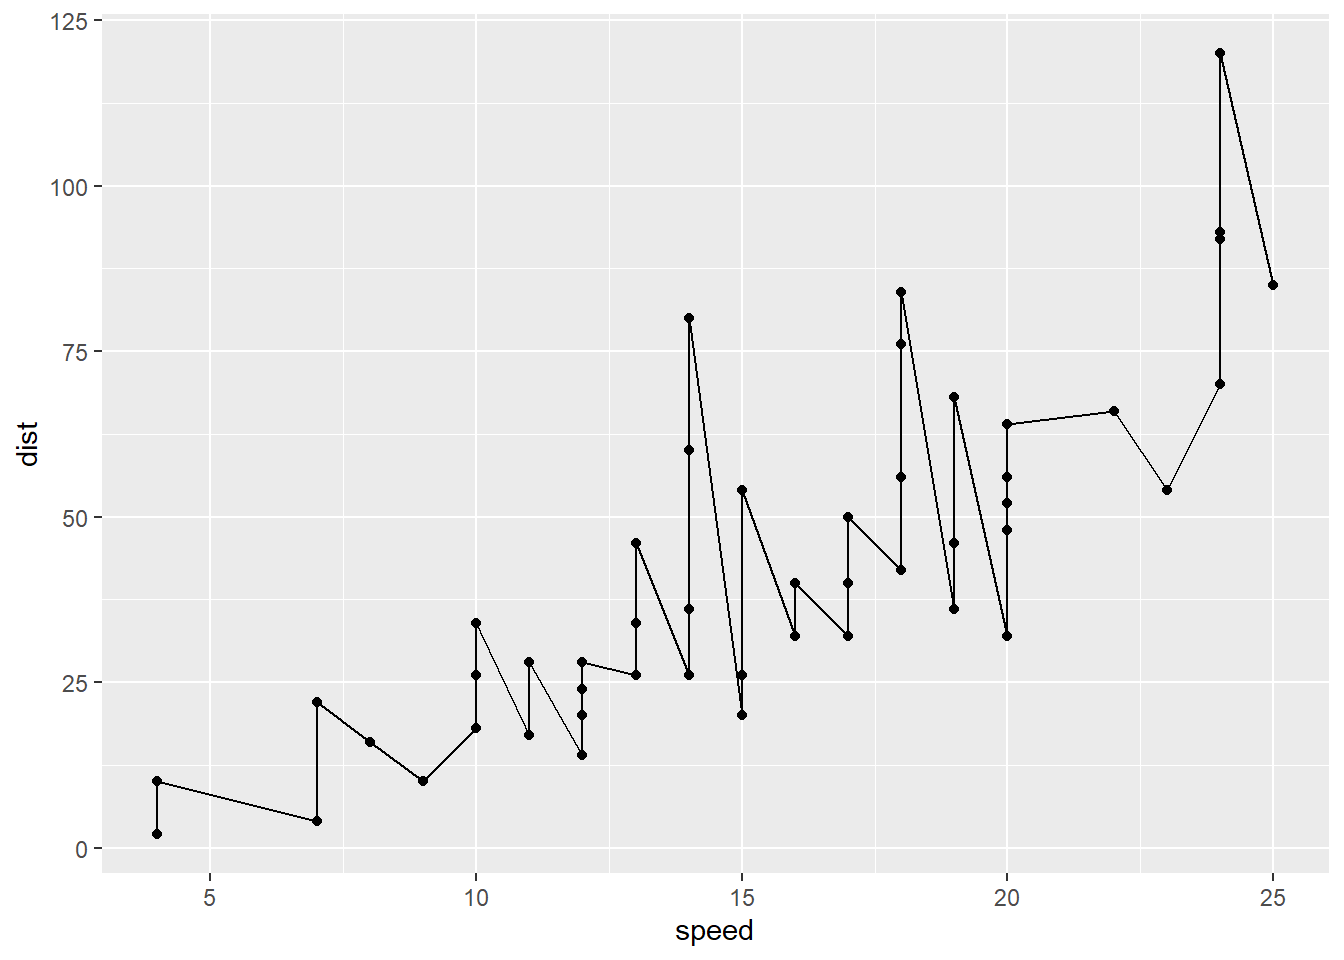
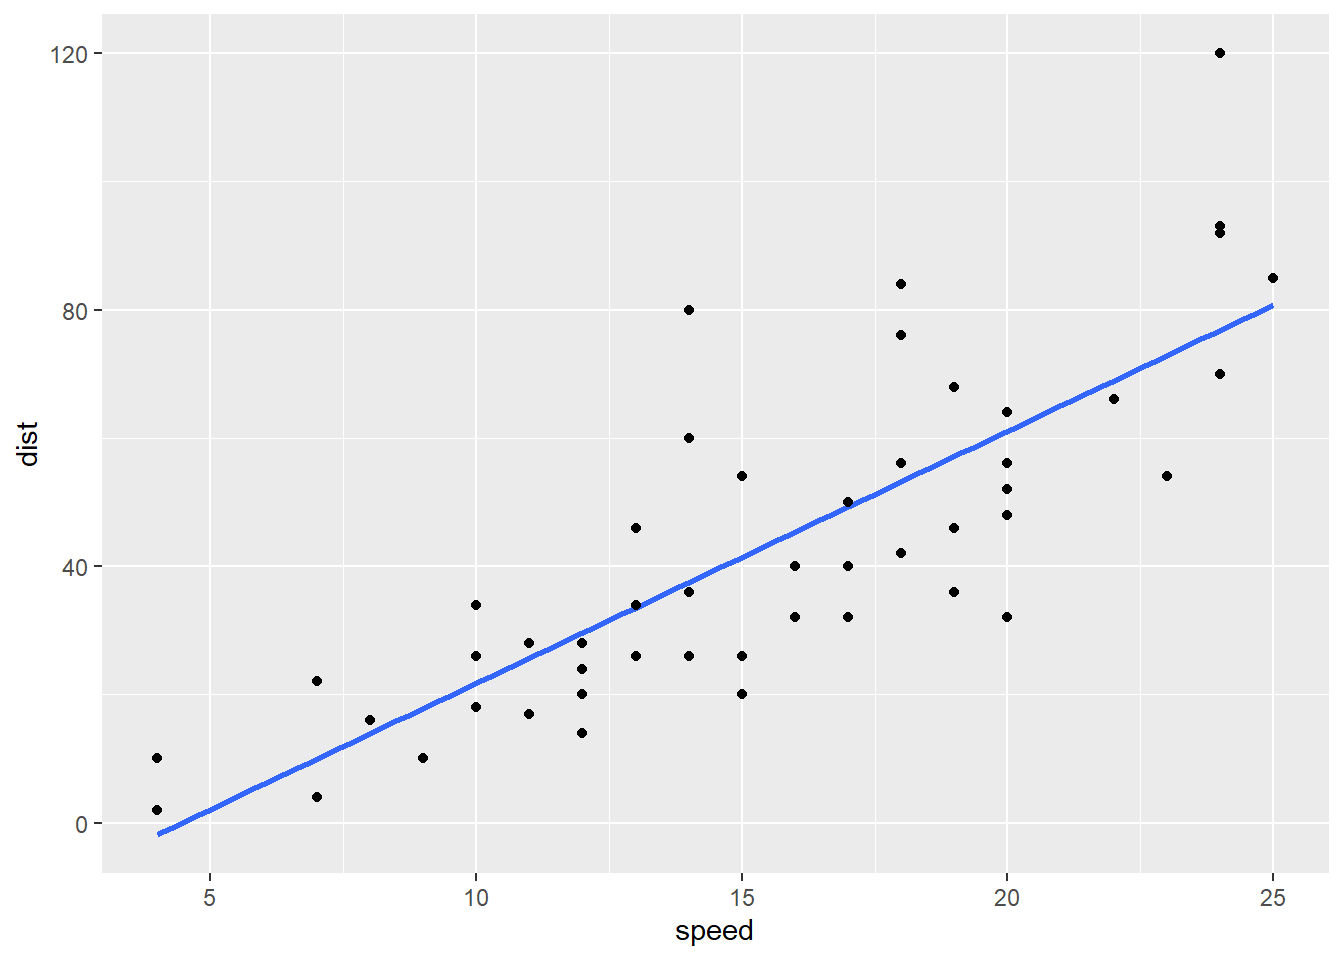
ggplot(cars) +
  aes(x=speed, y=dist) +
  geom_smooth(method = "lm", se=FALSE) +
  geom_point()
`geom_smooth()` using formula = 'y ~ x'